A non-invasive approach to finding respiratory syndromes in infants (Part One)

The toughest part about getting a B.Tech degree is probably the main project that needs to be submitted at the end of the course. A million questions arise every time it’s given a thought, contributing to numerous painful days and sleepless nights.
I had my fair share of doubts and discomfort while doing my project as well. Thankfully, I had three other friends in my group to share the pain with. And you know what, we did it! We completed the project, submitted a report, demonstrated it live in front of the evaluators (and impressed one of the toughest professors in our university), submitted a research paper on the project to an IEEE international conference, and got it accepted and published!
This is a small attempt to give hope to the engineering students reading this right now. If we could do it, trust me, you can too. Enjoy the process and go with the flow.
Enough small talk. Let’s get into the technicalities now, shall we?
Our project was developed to measure the respiratory rate of infants and determine the presence of any respiratory syndromes they may have. Most of the time, the respiratory rate isn’t measured at all, even though it’s one of the most vital parameters of health, and even when it is measured, it’s done so by attaching numerous sensors and other devices to the delicate skin of the infant, causing pain and discomfort. This is why we chose to go with a non-invasive approach to measure the respiratory rate, using the magic of thermal imaging.
All the steps mentioned in this blog were carried out in MATLAB, a computing environment and proprietary programming language developed by MathWorks.

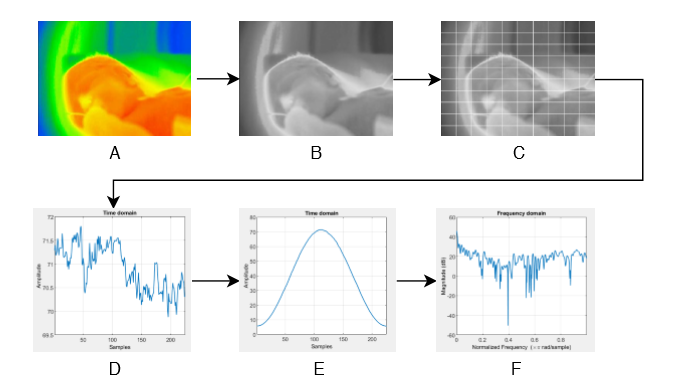
The first step is to extract each frame from the thermal video of the infant. Our video was 15 seconds long and had a frame rate of 15 frames per second, which gave us a total of 225 frames. Once that’s done, we applied a grid over each frame, splitting it into multiple Regions of Interest (ROIs).
This is where our project differs from other similar projects. Usually, only the nose or the chest region is monitored to determine the respiratory rate. The problem is that it’s difficult to maintain accuracy when the chest or nose region falls out of focus when the infant cries or moves. The grid solves that issue, by splitting the entire frame into potential ROIs. In our case, we used a 10×10 grid, which gave us 100 individual ROIs. Valid and invalid ROIs are determined later.
To extract the respiratory information from each ROI, we consider the mean pixel value in that space. The respiratory signal is formed by appending the mean pixel value of an ROI in each of the 225 frames one after the other, thereby giving us a total of 100 respiratory signals (since we have 100 ROIs) with 225 values in each signal.
These are just the raw signals we extracted; each signal needs to be preprocessed to make it more accurate and easier to work with. The first preprocessing step is to apply a Hamming window to the signal. You might be familiar with this term if you’ve studied Signal Processing, but in simple terms, it helps us get a more accurate idea of the signal when we convert it into the frequency domain shortly.
Once the Hamming window is applied, the signal is mean centred and converted into the frequency domain, as we require the rate of change of pixels to determine the respiratory rate. The signal is then normalized, and we finally got our respiratory signals.
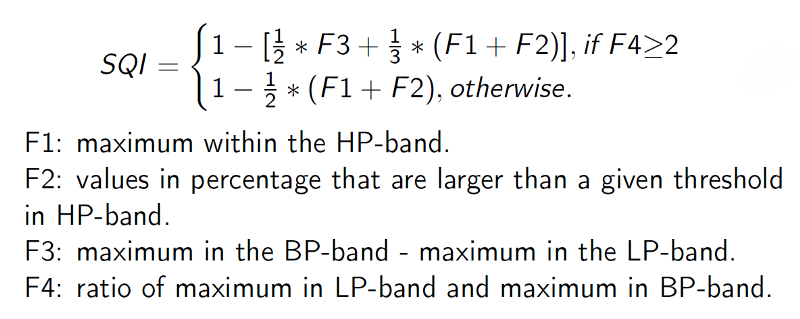
Remember when I said that valid and invalid ROIs would be determined later? This is the part where we do it. We now have 100 respiratory signals, extracted and preprocessed. All these signals will not have respiratory information though; most of it will be just noise. To filter that out, we use a formula called the SQI measure. It’s defined as shown below.

LP, BP and HP stand for Low-Pass, Band-Pass and High-Pass. Low-Pass is frequencies below 0.1Hz, Band-Pass is frequencies between 0.1 and 0.3Hz and High-Pass is frequencies above 0.3Hz. The threshold for calculating F2 was empirically determined.
The signals with an SQI measure greater than 0.5 are considered to be valid respiratory signals, and the respiratory rate is determined from only those signals by multiplying the maximum value in the signal by 60. For the rest, the respiratory rate is considered to be zero.
Finally, the respiratory signals along with their corresponding respiratory rates are exported as a CSV file for the next step; determining the presence of respiratory syndromes, which is explained in Part 2 of this blog here.
Enjoy Reading This Article?
Here are some more articles you might like to read next: